
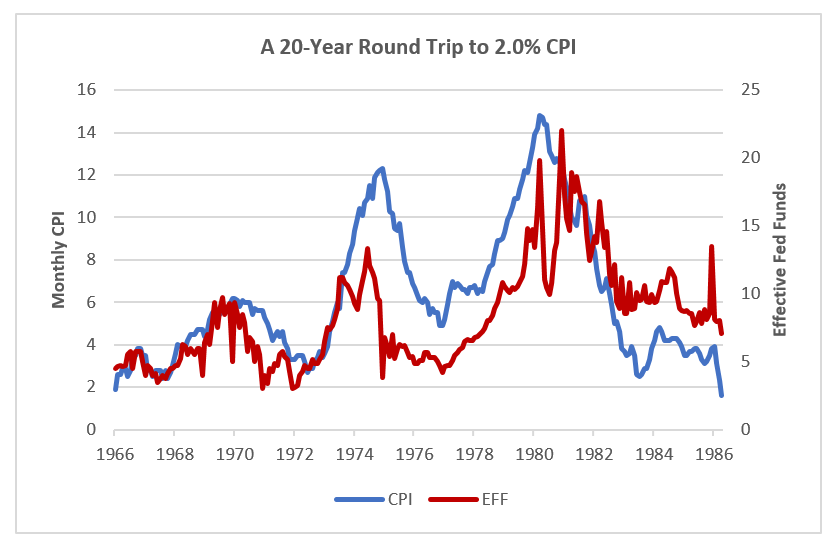
Tuesday’s 7.1% CPI print was an improvement from October’s 7.7% and well off the 9.1% peak (so far) posted in June. 7.1% is not price stability and there remains a large gap to the Fed’s stated 2.0% target range. The Fed raised rates another 50 basis points on Wednesday and communicated expectations that inflation pressures will drive additional rate increases well into 2023. It’s worth noting that there were multiple and material peaks and troughs in CPI during the 20 years between January 1966 when the Index printed at 1.9% and April 1986 when it finally moved back below 2.0%. Inflation isn’t over until it’s over and healthcare balance sheets will confront resiliency headwinds until we complete our own round trip back to 2.0%.
|
1 Year |
5 Year |
10 Year |
30 Year |
|
|
Dec 16—UST |
4.62% |
3.62% |
3.48% |
3.53% |
|
v. Dec 2 |
-6 bps |
-6 bps |
- 4 bps |
- 4 bps |
|
Dec 16 – MMD* |
2.66% |
2.43% |
2.47% |
3.42% |
|
v. Dec 2 |
+27 bps |
-10 bps |
-14 bps |
-6 bps |
|
Dec 16—MMD/UST |
57.6% |
67.1% |
71.0% |
96.9% |
|
v. Dec 2 |
+6.5 pts |
-1.6 pts |
-3.2 pts |
-0.6 pts |
|
*Note: MMD assumes 5.00% coupon |
||||
SIFMA reset this week at 3.73% which is approximately 86% of 1-Month LIBOR and represents a 188-basis point adjustment versus the November 30, 2022, reset.
Fun with Statistics—2022 Update
Last year around this time we posed the question of whether Federal Reserve policies since December 2008 created a statistical breakpoint. December 2008 marked the Federal Reserve’s introduction of the drug called Quantitative Easing into the U.S. capital markets. It started as a targeted strategy to help unlock certain funding markets, but it ballooned into something that profoundly distorted monetary policy, fiscal policy, and every corner of the global financial markets. Inflation is the current center of attention, and along with it the Fed’s goal of achieving price stability (monetary normalization) through reversion of its inflation benchmark to a 2.0% target range. But looming behind the inflation crisis sits the same fundamental question: what is “normal” for the relationship between the Fed, the U.S. economy, and the financial markets? The difference between these relationships before and after 2008 is staggering, and if the destination is a pre-Quantitative Easing world, then “solving inflation” is only the first stop on what is going to be a long, complex, and probably volatile trip.
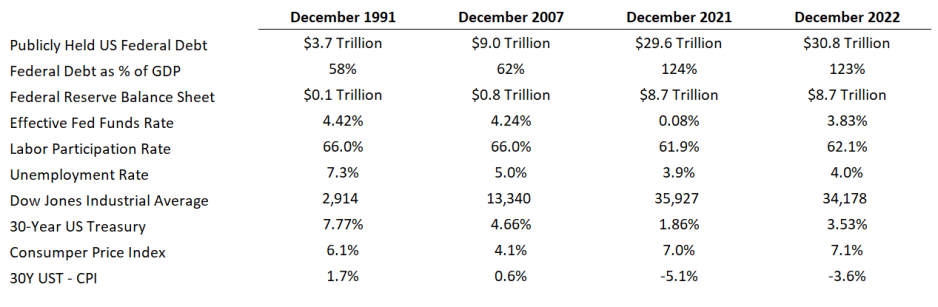
The following sections offer updated capital structure snapshots at four statistical periods:
- 2022: measured as of both December 15 as well as the average for the year.
- December 15, 2008, to December 15, 2021: the 13 years when the Fed actively intervened in markets via the combination of Quantitative Easing and accommodative Fed Funds rates.
- December 15, 1991, to December 15, 2008: the 17 years preceding the interventionist era, during which the Fed was an influencer only via the Fed Funds rate.
- December 15, 1991, to December 15, 2021: The combined thirty-year horizon.
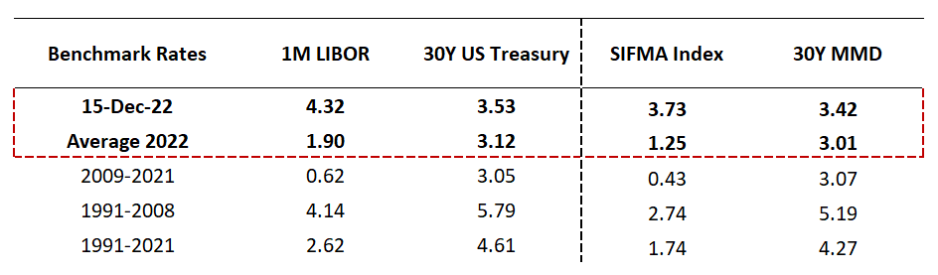
Benchmark Rates: When rates are low, the opportunity is to de-risk a capital structure by issuing long-duration fixed rate debt (the COVID era playbook). As rates move higher, the re-risking question (transitioning to shorter duration or floating) reemerges and capital structure decision-making becomes more complex. A major challenge is that while short-term rates have moved higher in response to the Fed’s anti-inflation efforts, long-term benchmark rates have remained relatively low; of course, credit spreads (fixed versus floating options) give important additional guidance on all-in funding rates as does the concept of “return on risk.”
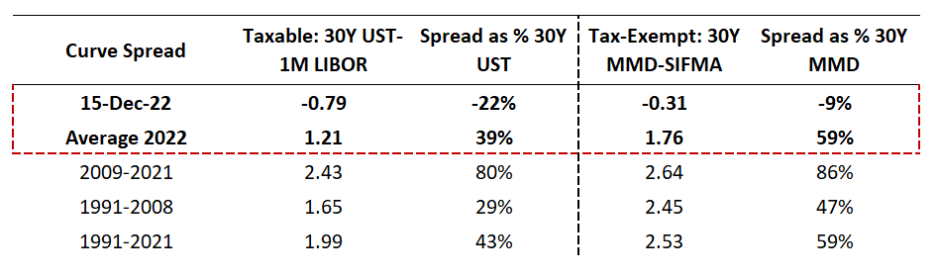
Curve Spread: The combination of absolute rates and curve shape defines “return on risk,” meaning the reward attached to retaining floating rate or shorter duration exposure. The 2009-2021 era showed strong curve spreads, but absolute rates were low enough to support a bias to fixed. Prevailing flat to inverted curves suggest limited risk value, and force decision-making to forward-looking estimates and the value of restructuring optionality (both grounded in the Fed reversing course and rates falling).
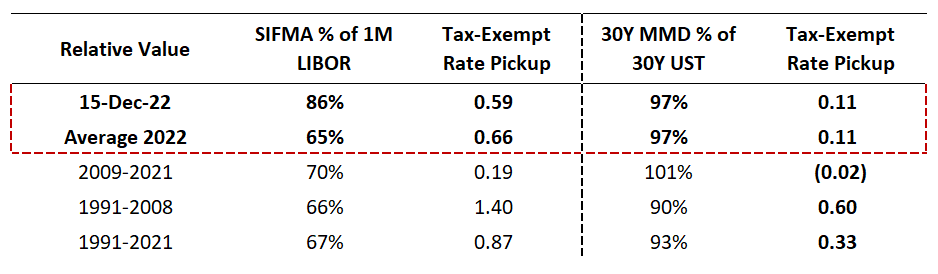
Relative Value: When tax-exempt to taxable ratios are low, issuing tax-exempt debt offers a relatively lower cost, with the benefit dependent on absolute rates (the greatest basis point value to tax-exemption comes from high rates and low ratios). Ratio performance varies significantly across the curve, with the front end including some seasonal attributes (SIFMA ratios are moving higher as year-end approaches). If history holds, ratios will fall as rates move higher and tax-exempt funding options will become more appealing. Relative credit spreads (fixed versus floating options) are an important decision-making input as is the escalating value of 10-year call options embedded in tax-exempt fixed rate structures.
Capital structure decision-making is always grounded in absolute and relative risk transfer pricing, or whether there is enough benefit from either retaining capital structure risk or issuing on a taxable basis. After a long run of markets that supported long-duration taxable fixed, we are back in territory where capital structure risk retention is on the table. One of 2023’s challenge will be that getting to the right answer will require matrix thinking, which means looking at capital structure composition as both a stand-alone decision (complicated by market distortions and the “what constitutes normal” challenge) and as an enterprise risk capacity allocation decision (complicated by the exceptionally elevated risk environment across operating and investing activities).
This is the last installment of this blog for 2022; expect the next installment on January 14, 2023. On behalf of all of us at Kaufman Hall, I hope each of you has a safe and restorative holiday season and a healthy, happy, and successful 2023.